Figure 1: Trace Visualizer main window, no trace
opened
| Linux Trace Toolkit Reference Manual | |||
|---|---|---|---|
| <<< Previous Page | Home | Up | Next Page >>> |
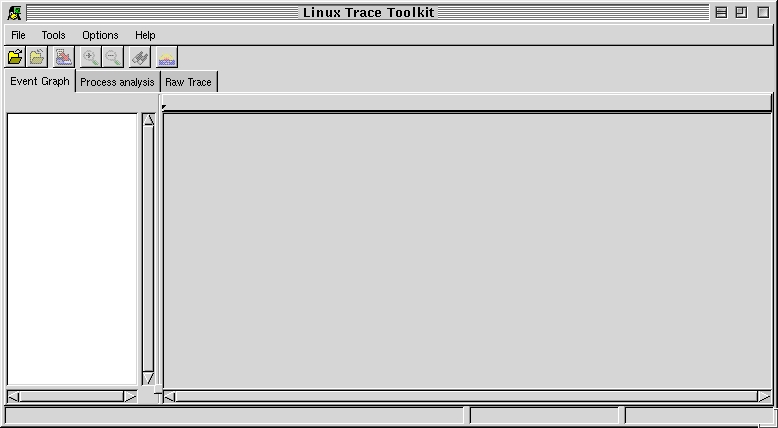
When first launching tracevisualizer without any command line options, you will be greeted with the following window:
Figure 1: Trace Visualizer main window, no trace
opened
NOTE: The precise look-and-feel of the window you get might be slightly different. This is because the GTK+ library allows themeing of its widgets. See gtk.themes.org for more details.
Most of the Trace Visualizer's functionality can be accessed through the main window's drop down menus. They are made up of the following:
6.1.1.1 The file menu
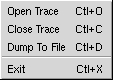 The file menu allows for
the following choices:
The file menu allows for
the following choices:
 The tools menu allows for the following choices:
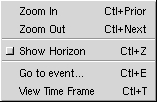
 The Options menu allows for the following choices:
 The Help menu allows for the following choices:
Once loaded with a fresh supply of data, LTT greets you with the event graph, as can be seen on figure 2. This thumbnail can be accessed by pressed 'g' or 'G' while in another thumbnail.
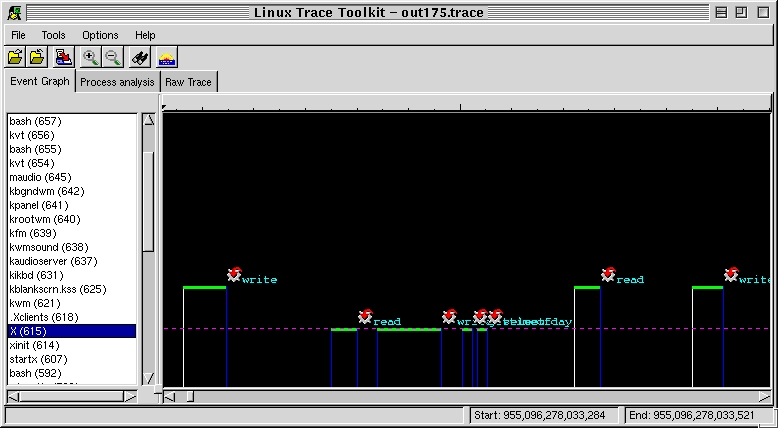
Figure 2: Linux Trace Toolkit main window, showing
a filled event graph
6.1.2.1 Icon legend
A lot of events can be identified on the graph by
an Icon. These are:
| Icon | Corresponding event |
 |
Bottom half |
 |
I/O end |
 |
I/O start |
 |
IRQ |
 |
Kernel Timer |
 |
Schedule change |
 |
System call |
 |
Trap |
Right clicking on an event icon will display the following contextual menu:
 This Contextual menu allows for the following choices:
The process list seen on the left side displays all
processes that were observed during data acquisition. Every horizontal
line is at the height of its corresponding process in the Process list.
Clicking on a process will display a selection line, to help with the visualization.
Alternatively, the Horizon can be activated.
The Process Analysis view allows you to view all processes that were present during data acquisition. Clicking on a process displays details about it. This thumbnail can be accessed by pressed 'p' or 'P' while in another thumbnail.
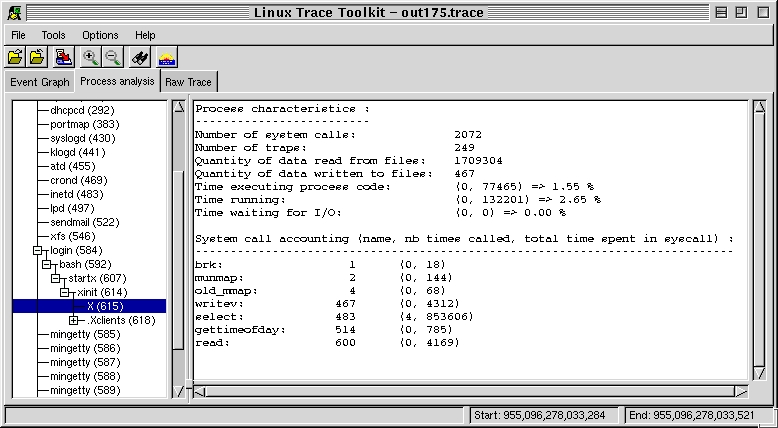
Figure 3: Process analysis view
The Raw Trace view is there to list all events that were logged by the data acquisition module. This thumbnail can be accessed by pressed 'r' or 'R' while in another thumbnail.
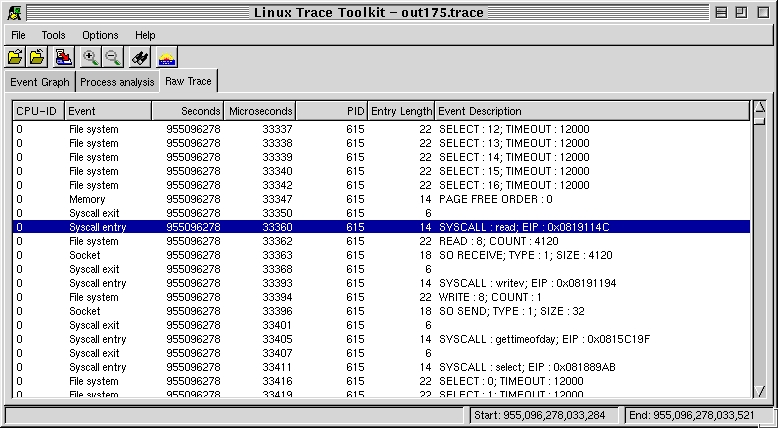
Figure 4: The Raw event trace view
6.1.4.1 Contextual menu
Right clicking on an event in the list will display the following contextual menu:
 This Contextual menu allows for the following choices:
| <<< Previous Page | Home | Up | Next Page >>> |
| Linux trace toolkit | Main window | ||