 Analyzing System Behavior and Performance Using the Linux Trace Toolkit1. IntroductionConventional performance measurement tools provide the user with only a glimpse of the system's behavior. They rarely enable him to get a complete understanding of the system's dynamics. LTT fills this gap by providing its user with all the required information to reconstruct a system's behavior during a certain period of time. By doing so, some previously difficult situations can easily be resolved. For instance, it will help the user answer some of the usually tough questions:
Moreover, LTT is open-source and distributed under the GNU GPL license. This
availability eases customization and promotes extensibility. LTT is available
through it's home page at: www.opersys.com/LTT.
2. ArchitectureLTT can report the following events with their details with microsecond precision:
In order to provide a high degree of detail without hindering system operation or performance, LTT is composed of 4 parts:
The first three components take part in the data collection and the last component is used for data presentation. These components interact in the following manner: 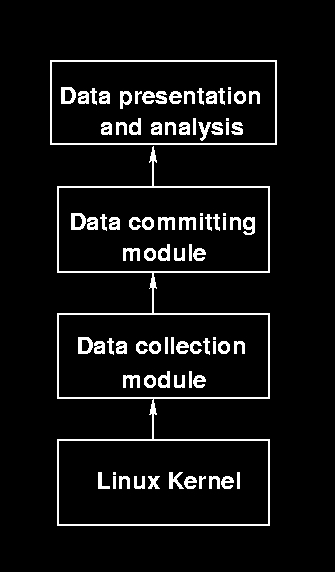 Correspondingly, the LTT package is mainly composed of the following items:
Once the patch is applied to the corresponding kernel and the system rebooted
with the new kernel, data collection can be activated.
3. ImpactGiven its high degree of precision it would be expected that LTT would bear a high cost in system performance. That is not the case. Practical tests have shown that when tracing core kernel events the impact remains lower than 2.5%.
On the other hand, the size of the generated traces can be large. Tracing a system
on which a GUI such as KDE or Gnome is running can yield 0.5MB of trace per second.
A "plain" system will typically yield less than 0.1MB of trace per second. The size
of the traces can be greatly reduced by tracing only the events necessary to the
underlying analysis.
4. Usage
To generate a trace, the system must be running a patched kernel. To start tracing,
the trace daemon is launched with the appropriate options. Here is an example trace
daemon launch command:
In order to facilitate the usage of the trace daemon, some scripts are provided.
The following command line is an example usage of such a script:
Once the trace is generated, it can be viewed using the data decoder. The following
is a sample command line to start the data decoding front-end:
Here again, scripts are provided to facilitate common usage. For example:
Both commands will lead to the display of the following interface:
The data decoder can also be used as a command-line utility only. This enables trace
analysis without the burden of a GUI.
5. ExamplesThe following examples illustrate the usage of LTT in resolving and/or understanding real-world situations. 5.1. Understanding Process Behavior
Understanding exact process behavior is often difficult. Interactions with the OS
are often opaque. LTT gives us an insight on how a process interacts with the OS.
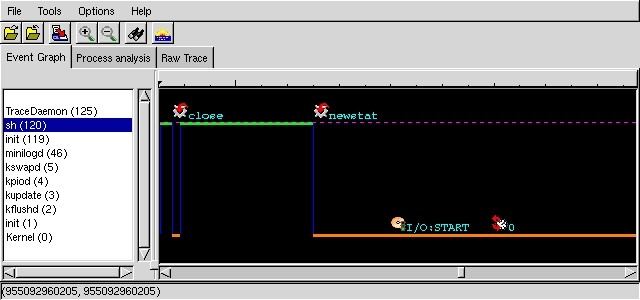
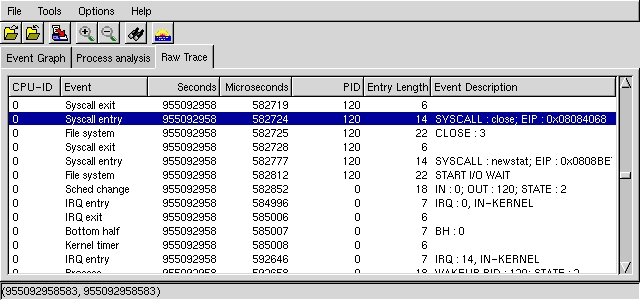
In a raw form, the information displayed in the graph is as follows:
 5.2. Performance Analysis of a ProcessWe can also get detailed performance measures on the observed process: 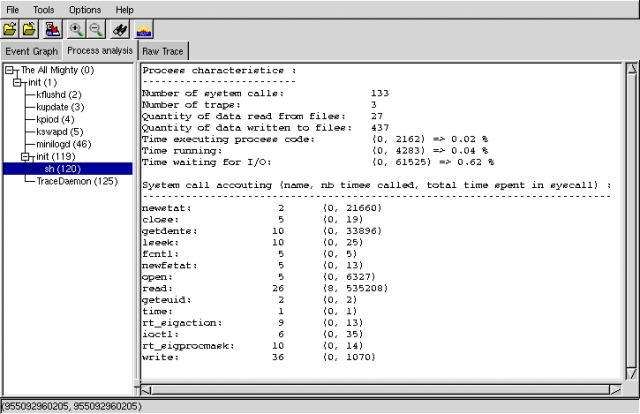 5.3. Understanding System BehaviorHere we can see the system reacting to the user pressing on the keyboard while the focus is on a command-line application called "main": 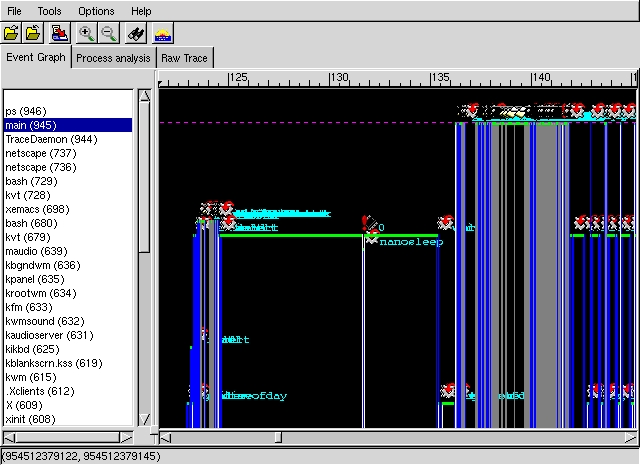 5.4. Performance Analysis of a SystemHere we see system-wide performance data which includes items unavailable through conventional tools: 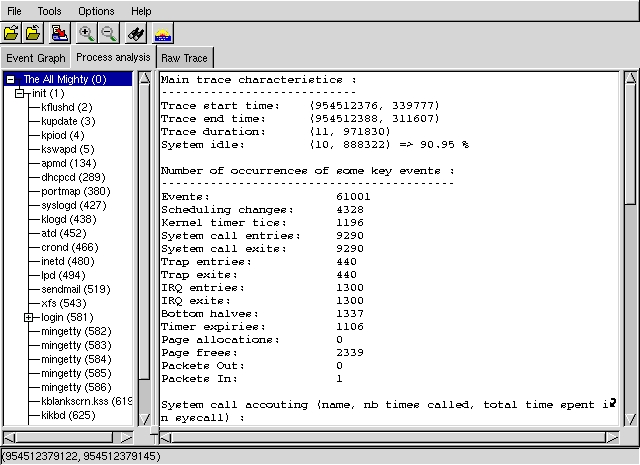 5.5. Solving Synchronization Problems
Synchronization problems are hard to solve. Take for instance this portion of code:
This will always output something in the form:
Using LTT, we get the following graph: 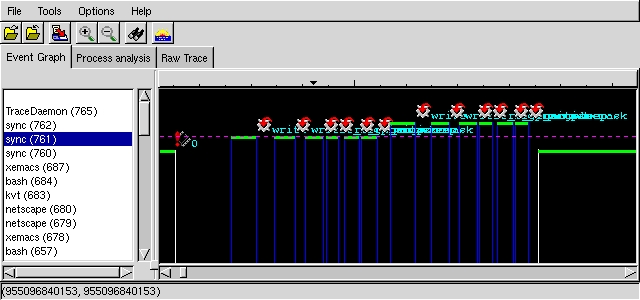 In the raw form, the events are as follows: 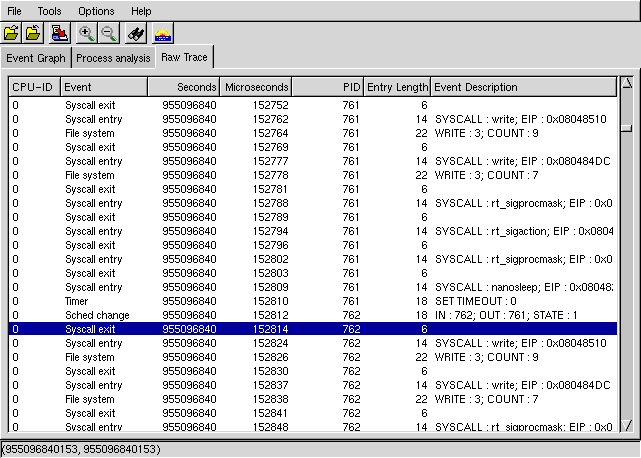 6. Future Directions and ConclusionLTT has been available for some time and has matured into an industrial-strength utility for performance analysis and characterization. Nonetheless, it is an ongoing project and the following is a non-exhaustive to-add list:
As the complexity of software and hardware increases, LTT will provide developers
with a versatile tool to deal with the different problems encountered.
Karim Yaghmour Copyright (c) 2000 Opersys inc. Last modified: Mon May 15 20:30:07 EDT 2000 |